Ever read through a sales report with pages upon pages of graphs that share a ton of data, but don’t necessarily tell a story?
A report with no narrative makes it inactionable—there aren’t any insights that you can use.
This causes a couple of problems:
- No sense of direction: Without the right focus on what’s being tracked, this blurs what actions need to be taken as a result.
- It’s too complicated: It takes a lot of work to compile gross amounts of data, but arguably even more work to digest it into something meaningful.
- Confusing messages: Working with too much information means sometimes it can spell out two different stories at the same time (e.g., the highest grossing product also has the highest churn rate, so what’s this actually saying?)
The key to creating a narrative is to select the right key points that help you build a story.
It starts with identifying your business goals, then choosing the right types of information to collect, which then allows you to take steps to reach those goals.
For instance, if a goal is to increase customer acquisition, then measuring data and reporting on customer retention isn’t going to tell a story of where you’re at with revenue growth through new customers. The result: wasted time and energy collecting information that’s irrelevant to your objectives.
In this post, we’ll cover:
- What exactly are sales KPIs—and how are they different from “sales metrics”?
- How to set more realistic sales KPIs in 3 steps
- 12 sales KPI examples
🤝 Close more deals with these free cold-outreach scripts. ☎️
What are sales KPIs—and how are they different from “sales metrics”?
A big part of managing a sales team is tracking your sales analytics. Think of sales analytics as a scientific approach to growing your sales pipeline by focusing on the data—identifying what’s happened in the past and using that information to inform how you should approach the future.
Sales analytics are important because they tell a story about the progress of your business over time. Without these analytics, every action taken would feel like a step in the dark with no certainty as to whether or not it was the right decision made.
Making up analytics is a set of metrics and key performance indicators (KPIs). Though their purposes are similar, there is a meaningful difference between them.
Sales metrics: Data points that measure any aspect of sales performance. They essentially let you know how your business is doing in a quantifiable way.
Example: Average call time per sales rep is a metric that tracks each individual’s efficiency.
Sales KPIs: Also data points that measure sales performance, but specifically ones that tell you how well you are at achieving a key business objective. They rally the team to work towards one unified direction and help prioritize efforts toward the same goals.
Example: Total number of sales closed per month is a KPI that tracks the team’s overall progress towards achieving greater revenue growth.
The key difference between metrics and KPIs is that metrics are more focused on measuring day-to-day success, whereas KPIs measure the performance of metrics most important to overall business goals.
What’s important for both sales metrics and KPIs is that these figures are only meaningful when looked at against other time periods. Knowing your business generated 150 leads in the month of March isn’t a good or bad thing until you see that the average monthly leads for the past year has been 250 (then you might get the message that it’s time to step up your team’s game).
Why are sales KPIs important for small businesses in particular?
Why bother with KPIs at all? Seems like a lot of upfront work to get them set up and measured accurately (which we’ll cover in the next section). While that’s true, the knowledge they provide to a business is crucial.
Think about every every step of the sales process…
- Identifying prospects
- Qualifying leads
- Connecting with leads
- Managing objections
- Providing solutions
- Delivering the product(s) or service(s)
- Following up and maintaining the relationship
With all these steps and variability at play, there’s going to be many opportunities for a team to perform better. The trick is knowing where those areas are and how to correct them. Sales KPIs help you figure out how to do just that.
Specifically, in a small business where salespeople tend to wear multiple hats like manage operations, talk to leads, and do admin work all at once, everybody might have their own way of getting work done.
This is where consistency and standardization will be important for small businesses that want to establish a solid sales framework for training new staff.
Again, KPIs can help you gain insight here into what’s working and what’s not working so that your team can standardize the best approach for training salespeople.
For instance, if one of the priorities for your business is to increase close rates by 5%, you might observe how effective your sales training is in helping sales reps close deals. If you notice this KPI is performing below your benchmark every month, it might indicate that there’s an opportunity for improvement within your sales training.
Here’s a similar real-life example with TouchBistro, a business that sells point-of-sale systems to restaurants. When their business went through rapid international growth, the team needed a better way to do sales training with new team members.
Using RingCentral’s cloud phone system, they were able to record and analyze sales calls, get all of their 300+ employees worldwide on a single business phone system, and coach them on their sales framework. The result? A 10% increase in close rates across all sales staff.
Get a closer look at how RingCentral’s outbound contact center platform works:
Now, let’s look at how to set realistic sales KPIs for your team.
How to set realistic sales KPIs in 3 steps
Step 1: Determine what your business is trying to achieve
First, in order to decide on what KPIs you want to measure, you need to first determine what it is you want to solve for—and during what time frame.
This is what we call setting your business objective. It should be specific and involve measurable steps you can take to achieve an overall goal.
For a small business, examples of business objectives might be:
Goal: Secure business funding.
Objective: Secure $93,000 in funding by November 1 to launch operations by December 1.
Goal: Grow sales profitability overtime.
Objective: Increase annual revenue by 15% for the top performing product by December 31 of the following year.
Goal: Nurture a positive workplace culture.
Objective: Increase employee retention rates by 10% by Oct 31 of the following year.
Objectives should be flexible enough to change as the business evolves and tangible enough that progress can be measured.
Once you have your objectives defined, it’s time to make sure it doesn’t get abandoned by setting accountability measures in place—this is where KPIs come in and the action takes place.
Step 2: Choosing the right sales KPIs
As you likely already know, there’s no shortage of data inside a business. But bear in mind that being available doesn’t mean that it’s useful.
If you measure everything that’s available, you’re going to be dedicating a lot of resources towards collecting information that may not end up being all that helpful. Plus, don’t forget what that means for your opportunity cost—time and energy spent towards one activity—and how it pulls time and energy away from another (perhaps to a more important task).
To determine whether a KPI is worth setting, make sure it meets these criteria:
- Relevant: How likely is the KPI going to affect the business objectives you’ve set? As in, will it help tell you whether or not you’re moving further away or closer to your objectives?
- Measurable: Can you track the progress towards achieving the objective? As in, you have the resources in place, whether that’s the manpower to do so or the right sales apps or tools to help you track the data.
- Actionable: Can you take step-by-step action to realize the value of the KPI? As in, you can realistically make incremental improvements to bring the objective to life.
Step 3: Choosing the right tools to use to analyze your sales KPI
To get started with or upgrade your sales analytics practice, you need two main things:
1. A customer relationship management (CRM) analytics tool
Foundational for any sales team is a CRM that gives you one view of all prospect and customer interactions, which team members can update and collaborate on.
CRM tools can help you:
- Organize contact information so that each prospect and customer has a dedicated profile for reps to view.
- Assign tasks across the sales team and keep everyone notified of activities and meetings underway.
- Identify sales opportunities and keep track of their progress as they move through the sales funnel.
- Automate tasks like data entry, lead generation, and creating outbound email campaigns.
Here’s an example of Zoho CRM, which comes packed with analytics features such as the ability to create reports just by dragging and dropping in data sets:
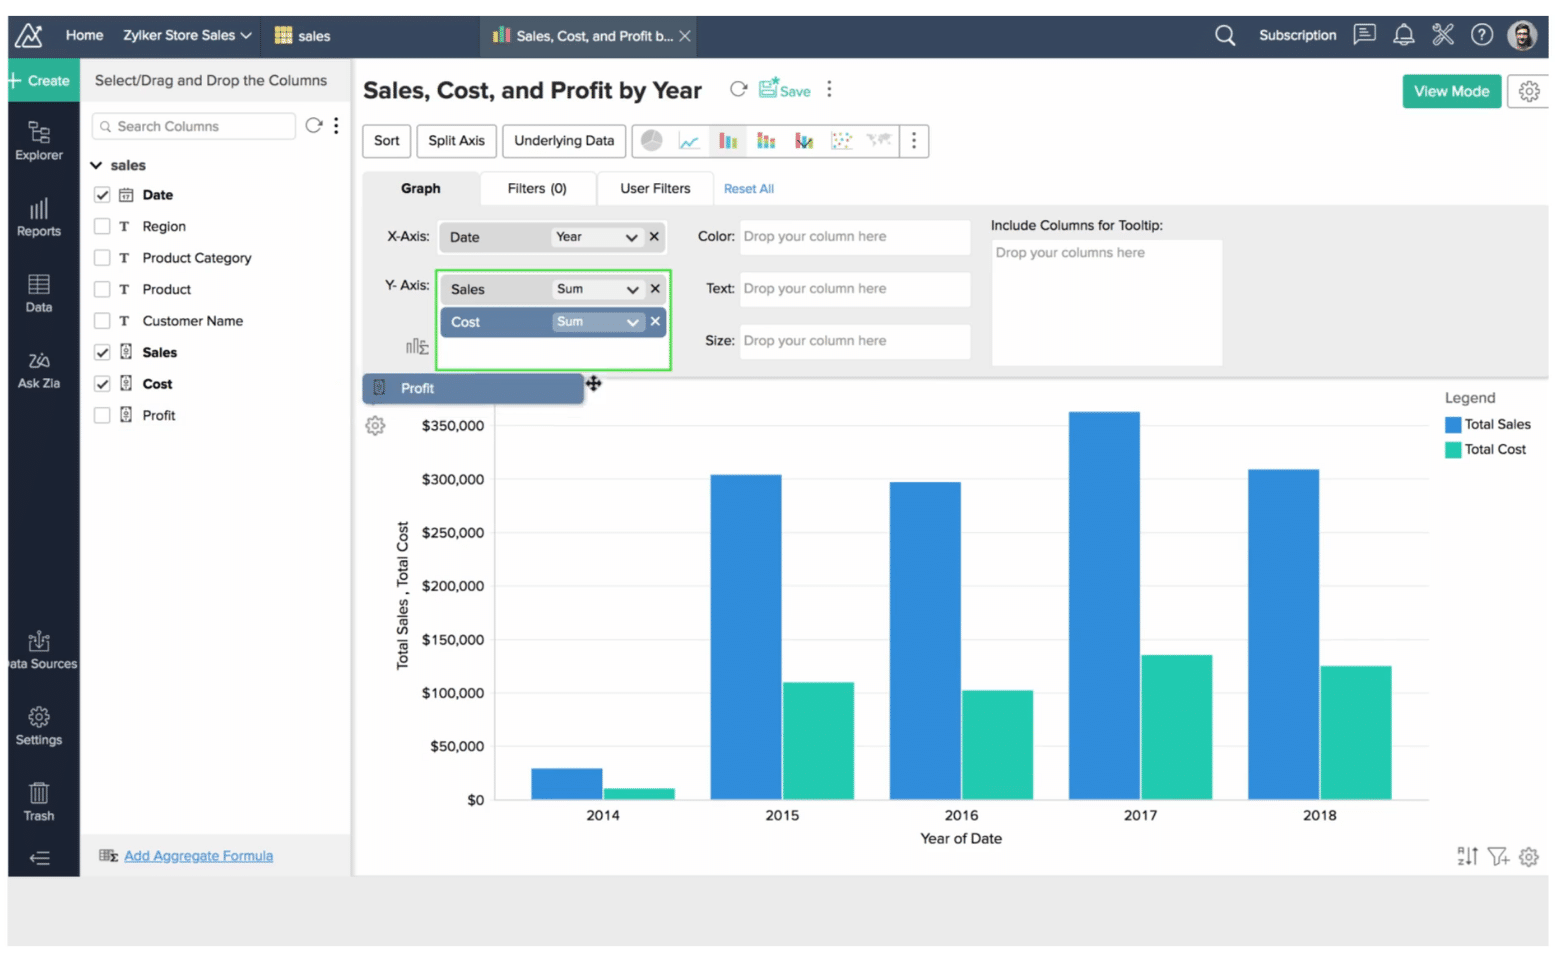
After choosing the right tool, you’ll want to create a custom dashboard that focuses on your KPIs. What’s important here is to create a concise view that shows only what’s needed and not every single metric you’re tracking. You want the dashboard to be useful—not a source of information overload.
To start tracking your KPIs, you’ll need to set up benchmarks to measure your sales data against.
Benchmarks can be formed based on your average performance overtime. For instance, if your customer turnover rate averages to be 3% over the last year, you could use this as your benchmark to beat moving forward. If you’re getting started and have no data to compare against, you can use your industry’s average.
To make sure you’re tracking your KPIs accurately, consider these two principles:
Relatable: Everyone on your team agrees on a common definition and measures the same item in the same way. If customer retention is being measured using four different tactics all using different scales, this isn’t relatable—and the final score isn’t going to be useful or meaningful.
Reliable: Everyone on your team should contribute to inputting data consistently into the CRM so that when reporting comes, it reflects as much of the team’s collective efforts as possible.
Finally, with regular monitoring of your sales information, you can catch discrepancies and reporting errors as soon as they arise, as opposed to being reactive and finding out where the error was much later down the road. Keeping a clean record of data is a must-do if you want accurate analytics reporting.
One advantage you have if you’re managing a small business is that you’re probably not inheriting legacy tools that are clogged with unusable data. Instead, you have the flexibility to explore affordable sales software that’s easy to onboard and right for you.
2. A business communications tool or phone system
Planning a sales call? In combination with the CRM analytics tool, every high-performing sales team needs a solid conference call service or all-in-one business communications platform—ideally that can integrate with their CRM.
Why?
Having a CRM is great, but most CRMs don’t let you make phone calls, run sales demos, and have sales meetings with your team—which are pretty important parts of a salesperson’s job.
That’s why, no matter which communication channels you’re using whether it’s email, chat, video, or text, you need a communication platform that spans all these channels (like RingCentral) while allowing you to talk to prospects. Oh, and it’s great for omnichannel customer service too.
With conference calls being still tremendously relevant in sales communication, having a virtual phone system that integrates with CRM tools (like Zoho and Salpo) means that you’ll have a much easier time tracking certain sales KPIs.
For example, using RingCentral’s integration with Salpo, you can schedule communications directly in the CRM and then click-to-dial to directly call a contact—while pulling up contact notes on your screen to reference during your call:

When the call wraps up, its activity automatically gets logged in both places to let you focus on making sales rather than be burdened by administrative tasks.
Learn more about the best cold calling software for small businesses.
12 sales KPI examples
KPIs for overall sales management
1. Monthly sales growth
What it is: Indicates your team’s ability to grow revenue in sales month-by-month, typically shown as a percentage. This is an overarching KPI that affects broad strategic decisions such as priorities in which products to push for or how to further optimize the sales process.
What it signals: Decreasing or stagnating revenue growth suggests competitors may be entering your space and capturing more market share than anticipated. It’s a powerful data point to get team members across the board to understand the overall profitability of your business.
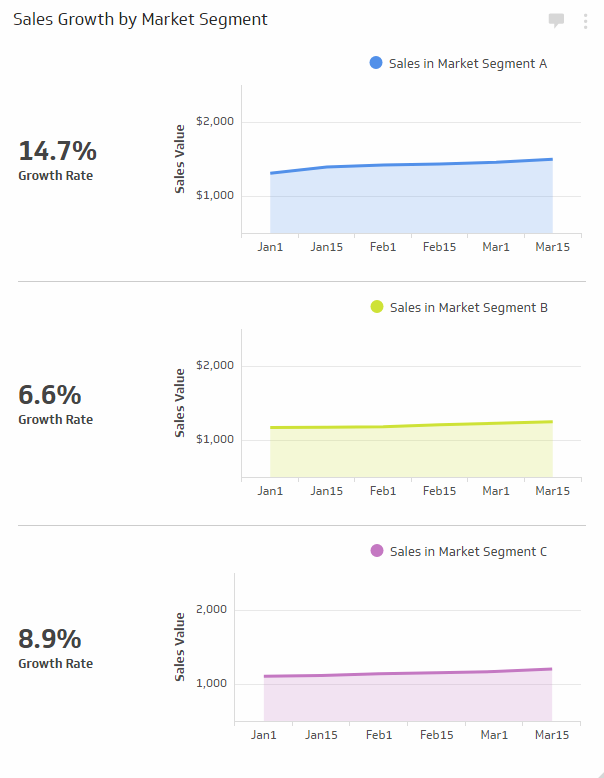
Example of sales growth being tracked across various segments of the market
2. Sales cycle length
What it is: The average length of time to close a sale starting from the initial point of contact with a lead. From a management perspective, this can be used to see differences in close times between reps—are some closing in eight months, while others close in three? What’s causing the differences?
What it signals: The effectiveness of your sales strategy and how it performs throughout the sales process. By knowing your business’s benchmark for the average time to target, you can identify opportunities that are open way beyond target and take action, or you can learn from opportunities that have closed much earlier than the average time.
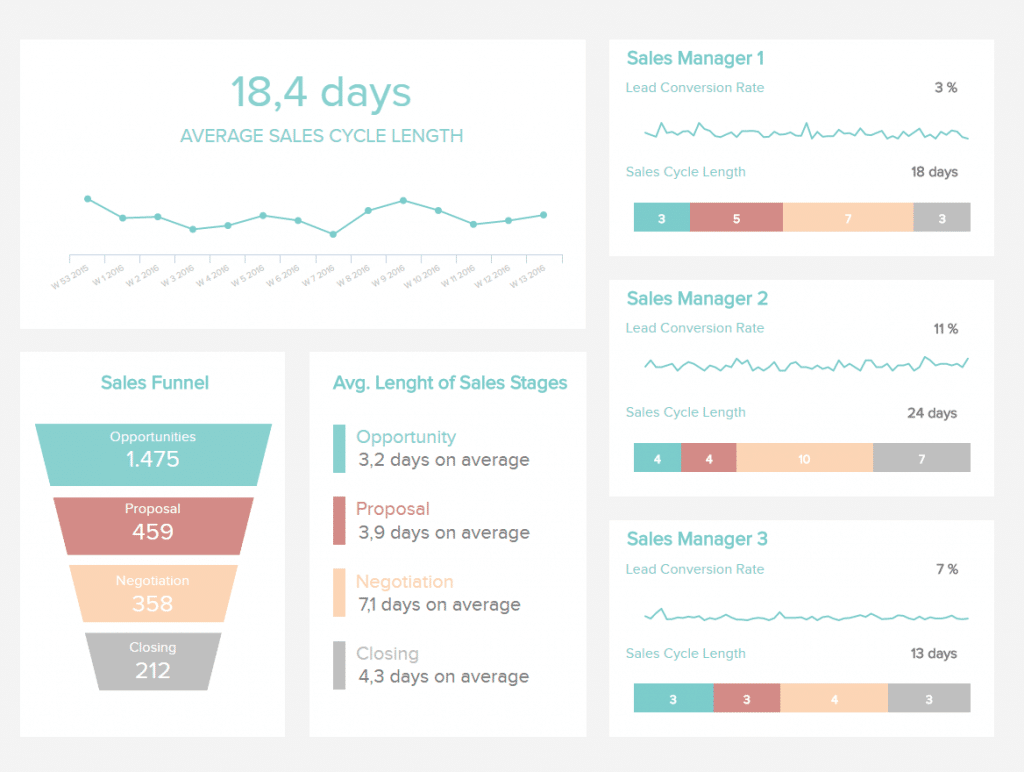
Example of the sales cycle length broken out by stages of the sales funnel and per rep.
3. New leads
What it is: How many prospects have been qualified as leads who have a good chance of converting into customers. This number can be further broken out by sales territory or rep.
What it signals: A decreasing number of new leads over time might reveal a number of issues on the marketing side. But watch out—having lots of new leads isn’t always good either. For instance, an ineffective website that provides vague product information could bring a large number of false leads to the table, which the team then wastes energy trying to qualify.
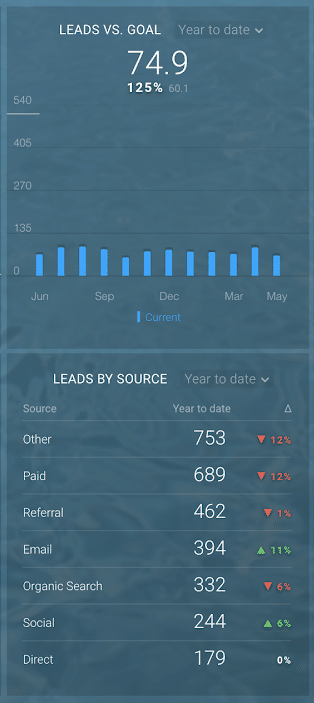
Example of new leads measured against a goal and then broken out by source.
4. Employee satisfaction
What it is: Feedback from your team on how satisfied they are on the job. This KPI can be shown as a numeric ranking for how happy or unhappy the general team feels. For team members working remotely, this is an important check-in to make sure their voices are heard and accounted for as well.
What it signals: 69% of employees say they’d work harder if they were better appreciated.1 That’s a lot of lost productivity. One factor that contributes to low employee morale is being bogged down by tools that don’t allow them to work as productively as they’re able to. When Goosehead Insurance decided to stop putting up with just reacting to phone ticket requests and started investing in a virtual phone system that empowered them to act proactively, this drove up productivity along with satisfaction. Keeping strong morale generally correlates with job performance and has a tangible impact on the bottom line.
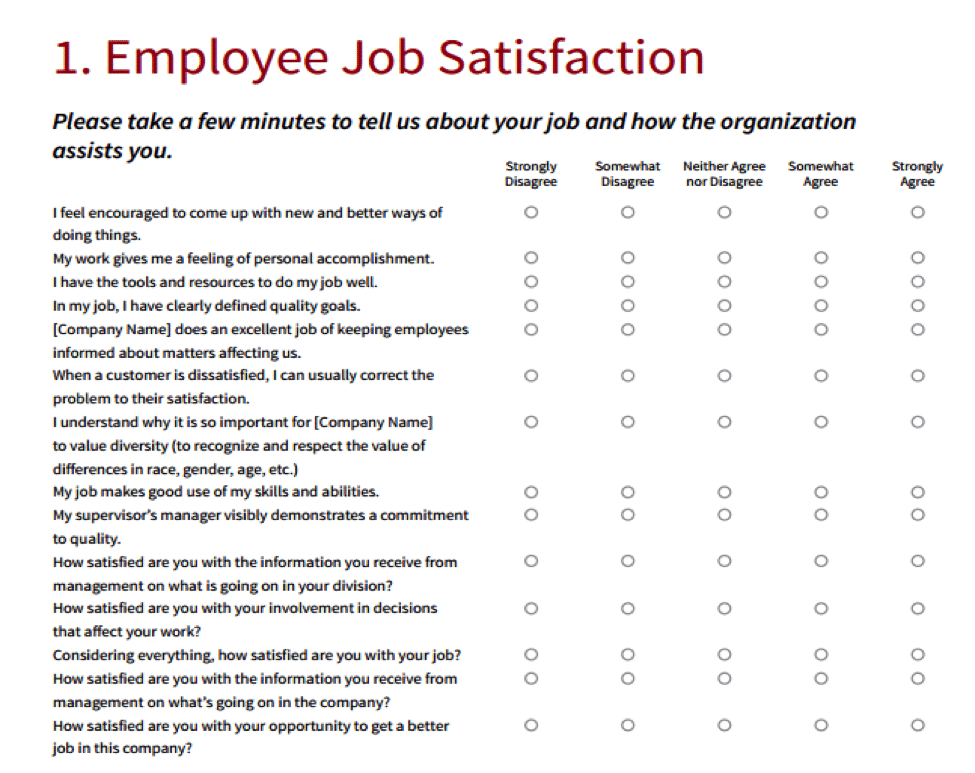
Example of an employee engagement survey to get a pulse on how employees feel about their job.
KPIs for sales reps
5. Monthly calls or emails per rep
What it is: For outbound sales teams, this measures how many prospects each sales rep is interacting with (and might help you figure out if cold calling really works anymore). For even more visibility, this KPI can be broken down into whether the call was picked up, what the time spent on it was, or interest levels.
What it signals: For the individual rep, they’re able to compare within a given amount of time how productive they were for that period. In periods where numbers are down, teams can reflect on if their communication techniques or tools are performing effectively. For instance, without an effective collaboration hub, reps can face connectivity interruptions, or work more slowly because they need to dial into physical phones.
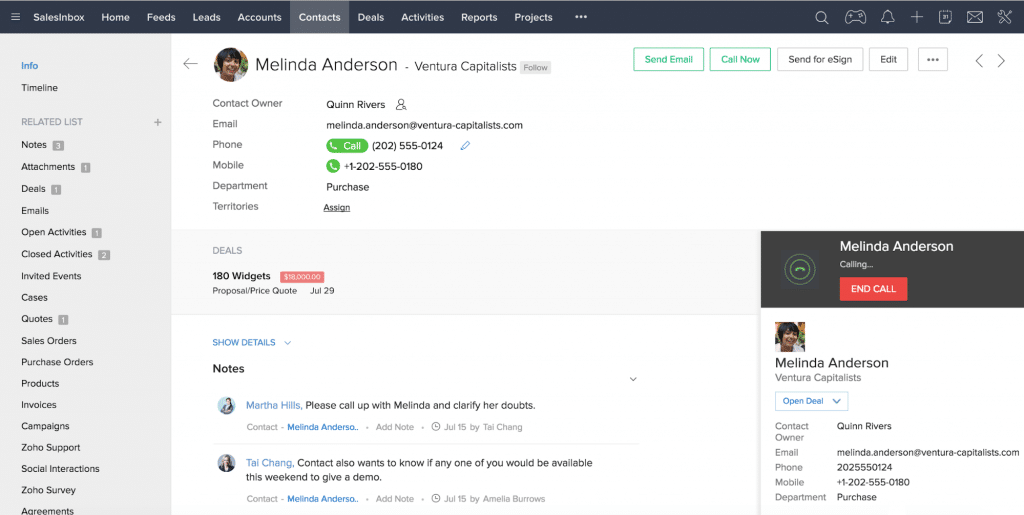
With a CRM + phone system integration, all a rep needs to do is click to dial a prospect. No more manually dialing.
Learn more about cold calling scripts.
6. Lead-to-sale conversion rate
What it is: A way to see how many leads are actually converting into purchasing customers versus leads that have dropped off and are no longer being pursued as prospects. This is typically represented as a percentage.
What it signals: If the conversion rate is falling below target, consider at what point leads have stopped progressing through the funnel. For rates that exceed target, learn from what contributed to their success so that you can repeat the process in the future. This data point is key to learning what makes for a successful sales pitch.
7. Lead-to-sale conversion time
What it is: Similar to the last KPI, except this measures the time it takes for a lead to convert into a purchasing customer.
What it signals: When coupled with the conversion rate, it gives you a more rounded picture of how effective your sales strategy actually is. If rates are exceeding the target by 9%, yet it’s taking double the time to convert, then you might be eating up too much cost in the process. There are ways to shorten conversion times, for instance by shaping offers to prospects in a way that feels personalized in order to reduce the back-and-forth time to get to close.
8. Sales by contact method
What it is: This is a useful KPI that helps you track where successful sales have originated from—whether that’s from a phone call, email, text, online chat, or in person conversation. To boost the usefulness of this KPI, you can also measure the cost and time associated with each method.
What it signals: Understanding the best way to reach your specific group of prospects can help you reallocate your efforts better. If reaching prospects by phone isn’t as effective in comparison to other online methods like email or texting, consider shifting your investment towards other communication tools to meet your leads where they are.
KPIs that measure customer activity
9. Customer acquisition cost
What it is: The cost of every new lead that converts into a customer, which considers costs that come from both the marketing and sales side.
What it signals: Tracking costs keeps you accountable for your sales and marketing spending. The benchmark for what costs make sense will depend on what margins you have on your products. For instance, if a marketing campaign averages out to cost $40 per prospect, yet the revenue generated from the prospect becoming a customer is $800, then that is a generally healthy cost to set as a target.
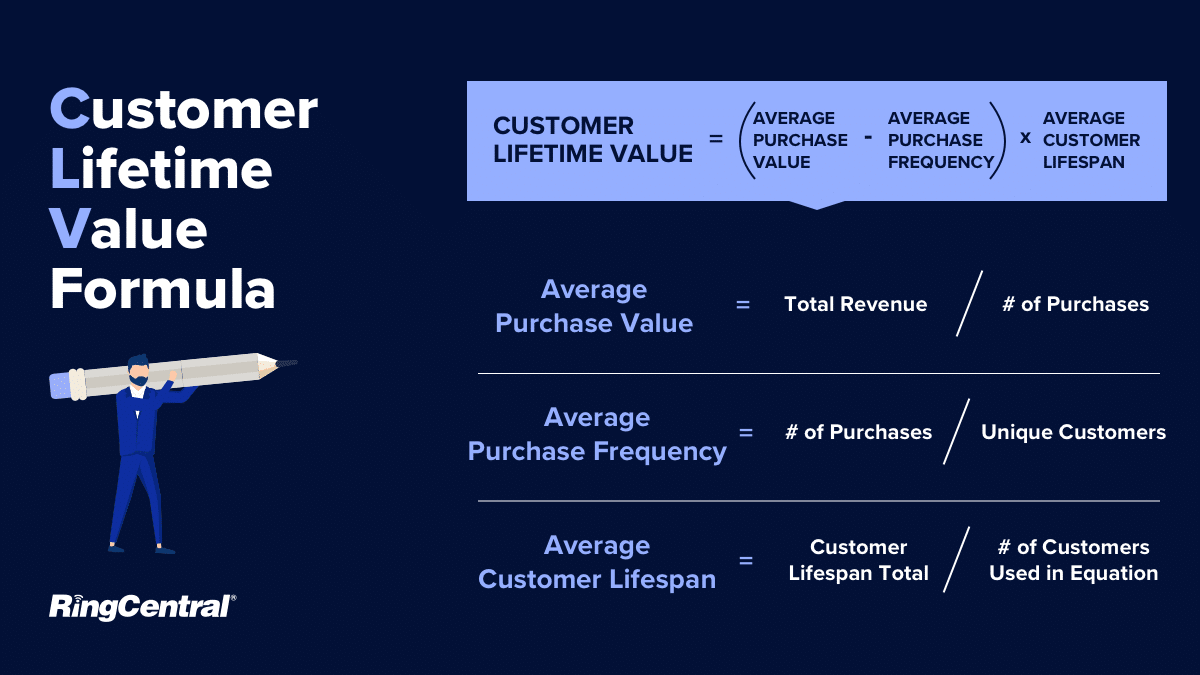
10. Customer lifetime value
What it is: Tracks the amount of revenue that a customer brings during the life of their business with you. It is a longer-term view that shows whether or not customers stay with a business beyond the initial transaction.
What it signals: It allows you to forecast the profitability of a customer or customer base to help you better determine what is a good budget to set for acquiring them. For instance, if it’s determined the average lifetime value of a customer in their 30–40s is $5,300, but a customer in their 40–50s is $3,000, then this informs how you should be spending more to attract the former, more profitable segment.
11. Customer turnover rate
What it is: The rate at which customers stop doing business with you in a given period of time. The average rate is typically determined by the industry that you’re in. For instance, a bank’s turnover rate is between 20–25%, whereas a software provider business’s turnover rate is only 5–7%.2
What it signals: There are two categories of turnovers—voluntary (rooted in dissatisfaction) or involuntary (driven by larger forces, like a downturn in the economy). A large drop in voluntary rate can signal issues with customer service, dissatisfaction with your product or service, or even new competitors that’ve successfully lured them away. Maintaining an understanding of customer attitudes towards your business can prevent turnovers before they happen.
12. Net Promoter Score (NPS)
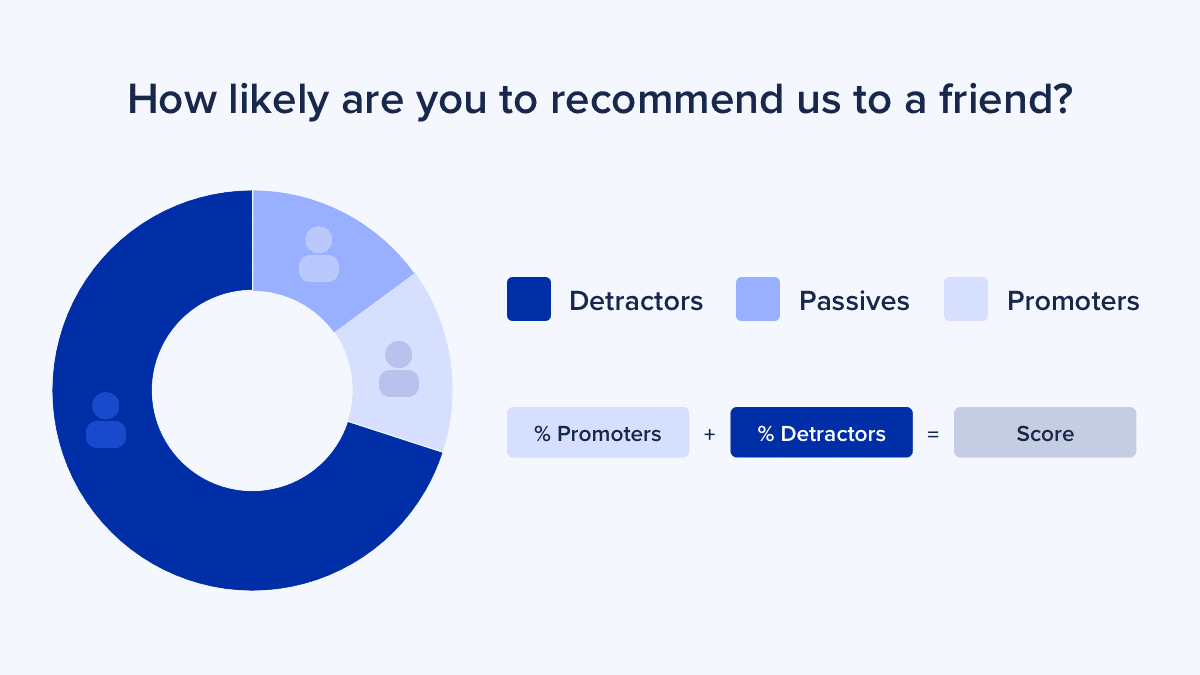
What it is: Shows the likelihood of an existing customer to recommend your business. Typically measured through customer feedback forms, customer surveys, or short interviews.
What it signals: Beyond just the numbers that show how much profit was earned or how many customers were acquired, this is information that provides insight into your customer’s experience. It’s a good way to get a pulse on your customers’ view of your brand. If you look at the NPS alongside the customer turnover rate, this can help you predict when a customer is likely to end their business with you.
Promoters are loyal to your company and may help drive sales, Passives do business with you but aren’t particularly tied down to your products or services, while Detractors are customers who aren’t satisfied and may drive sales away from your business:
What do sales KPIs mean for you?
To choose the right sales KPI, you have to understand what your business objectives are.
KPIs are unique to every industry (selling to consumers will be different than selling to businesses or the government) and while we’ve covered 12 popular ones in this article, the right ones for you aren’t necessarily going to be everything on this list.
Choose the right sales KPIs for your team and industry—it’ll help you exert effort into work that’s aligned with where your business is heading.
1 blog.smarp.com/employee-engagement-8-statistics-you-need-to-know
2 bizfluent.com/info-8464914-customer-turnover.html
Originally published Jul 07, 2020, updated Jun 21, 2024


