


If you’ve been in business for even a little while, you likely track some sales metrics already.
But are you tracking the right metrics? And how can you use this information to close even more deals?
The key is to identify the sales metrics that matter most and focus on the insights you can find by tracking them. Sales metrics illuminate your sales activity and can be used to evaluate the effectiveness of your sales process.
In this guide, we’ll cover:
- What sales metrics are
- How sales analytics can improve performance
- 5 major types of sales metrics
- How to determine the right sales metrics to track
- Helpful sales metrics hack: Integrate your CRM with your business phone
- Challenges of tracking sales metrics and analytics
☎️ Close more deals with these free cold outreach scripts.
What are sales metrics?
Sales metrics are data points that can help you evaluate whether your sales process is working. Sales performance metrics are generally used to make sales teams more effective and improve the conversion rate of leads into sales.
Other types of sales metrics can also help you achieve these goals: pipeline metrics, activity sales metrics, lead generation sales metrics, and key performance indicators (KPIs).
How do sales analytics improve performance?
Trouble spots for sales teams are often revealed by a careful look at sales metrics. For example, your pipeline metrics may reveal that your sales funnel is full of unqualified opportunities, or that there aren’t enough prospects in your pipeline. Your activity sales metrics may show a lack of activities such as phone calls and emails throughout the process. These problems may indicate that your sales team is stuck.
Using the right sales analytics tools helps organizations find and correct problem areas in sales activities. Look for an analytics tool that provides real-time data about your sales reps’ activities at every stage of the sales process. Leverage sales analytics data to find out where your sales team is having problems, so you can fix them and generate better business results.
Stay informed with RingCentral
5 major types of sales metrics
There are many types of sales metrics, including:
- Pipeline metrics
- Activity sales metrics
- Conversion metrics
- Lead generation sales metrics
- KPIs
Let’s look a little more closely at each of these categories.
1. Sales pipeline metrics
Pipeline metrics, also known as sales funnel metrics, show how many people are moving through your sales process. Pipeline metrics include open rates, close rates, win rates, average deal size, opportunity to win rate, and deal close rates.
- Average length of sales cycle: An estimate of how long it takes, on average, to go from initial contact to purchase or sale.
- Total open opportunities: The number of opportunities in your sales pipeline which have not been converted into a sale. This is counted from the date that the opportunity was created, not the date that it was last updated.
- Opportunity close rate: The percentage of opportunities that are closed into deals. It is calculated by taking the number of closed opportunities and dividing it by the total number of opportunities.
- Closed opportunity win rate: The percentage of closed opportunities won by your company. It is calculated by taking the number of closed opportunities that were won and dividing it by the total number of opportunities that were closed.
- Weighted value of pipeline: The worth of your sales pipeline measured by multiplying the opportunity amount by the probability of a close.
- Total value of sales: How much your sales team has sold in total.
- Annual contract value: How much revenue was booked from the total amount of closed deals
- Open rates: The percentage of leads that have opened email offers you sent them
- Close rates: The percentage of leads that have been closed
- Win rates: The percentage of leads that have been won
- Average deal size: The average amount of money generated from a single client or customer
- Opportunity-to-win rate: The percentage of leads that are likely to turn into real business
- Deal close rates: The number of deals closed divided by the total number of deals at any given time
2. Sales team activity metrics
Activity sales metrics measure the performance and behaviors of your sales team. Some important sales activity metrics to track include:
-
- Calls made: The number of phone calls made
- Meetings booked: The number of meetings scheduled
- Events attended: The number of events you’ve attended related to your core product
- Leads created: The number of leads generated by sales activities
- Social media connections: The number of social media connections your individual salespeople have
- Calls to meeting ratio: The percentage of calls that lead to booking a meeting
-
- Demos or pitch presentations: The number of demos requested or pitches presented
- Proposals: The number of proposals sent
- Upsells and cross-sells: The number of upsells or cross-sells completed
- Time spent on data entry: The percentage of time your sales team spends on data entry vs. engagement-specific activities

3. Customer conversion metrics
Conversion metrics track how quickly and efficiently you close deals. Here are some examples:
- Revenue: The amount of money made from a single deal or customer
- Average revenue per order: The average amount of money generated from an individual purchase
- Average number of orders per month: The approximate number of purchases made in a month
- Customer acquisition cost (CAC): The average amount spent for each new customer
- Customer lifetime value (CLV): The revenue generated from a single customer over their entire relationship with your company
- Customer attrition rate: The percentage of customers lost in a given time period
- Cost-to-serve: The cost of providing service to a customer or client
4. Lead generation metrics
Marketing goes hand-in-hand with sales to close deals. Analyzing your lead-generation process helps track how well your marketing strategies are working. There are lots of potential lead generation metrics to track, including:
- Form completions: The number of times your contact forms have been completed. This is only tracked if your contact form is on a landing page.
- Contact requests: The number of times you’ve received a web form submission requesting more information
- Contacts added to a list: The number of people your marketing team adds to a mailing list from events, trade shows, etc.
- Lead qualification: The number of leads that were qualified by sales
- Opportunity creations: The number of new sales opportunities created in your CRM
- Opportunities progressed to sales-ready: The number of sales opportunities that are marked as being sales-ready in your CRM
- Frequency of new opportunities: The number of new opportunities opened every month
- Opportunity win rates: The percentage of opportunities that turn into deals won by your company
- Lead-to-opportunity win rates: The percentage of leads that turn into opportunities won by your company
- Opportunity close rates: The percentage of opportunities that turn into deals closed by your company
- Opportunity loss rates: The percentage of opportunities that were lost by your company
- Marketing qualified leads (MQL) to sales-ready qualified (SQL) rates: The percentage of marketing qualified leads that become sales-ready leads in a given time period
- Opportunity-to-SQL rate: The percentage of opportunities that become sales-qualified leads in a given time period
- SQL close rates: The percentage of SQLs (sales-ready leads) closed by your team
5. Sales KPIs
A key performance indicator (KPI) is a measurement that helps you determine whether your sales team’s performance meets the standard set by your organization. It is a number that you use to measure the effectiveness of your team.
KPIs are different from other types of sales metrics because they go beyond simple numerical values. They also include qualitative measurements, such as how well your sales team is using social media to communicate with clients.
Key performance indicators can be divided into four different categories:
- Account management indicators
- Team management indicators
- Sales process indicators
- Financial indicators
Examples of KPIs you might want to track include:
- Number of new accounts created
- Number of new opportunities won
- Average deal size per customer
- Total number of closed deals per month or quarter
- Customer acquisition cost per customer
- Average revenue per account
- Number of leads generated through social media or email marketing campaigns
- Value of new business won versus lost
- Total number of unengaged customers
- Customer satisfaction score
- Number of deals added to the pipeline daily, monthly, or quarterly
- Individual salesperson’s average deal size compared to sales team’s average deal size
- Number of deals lost compared to the number of deals won each quarter, month or year
- Customer retention rate
- Number of proposals created versus number of proposals won
KPIs can also be a bit more difficult to pin down because they will be unique to your team.

Helpful sales metrics hack: Integrate your CRM with your business phone
Tracking lots of complicated metrics can take a lot of time, especially if you have to pull your data manually every month or quarter.
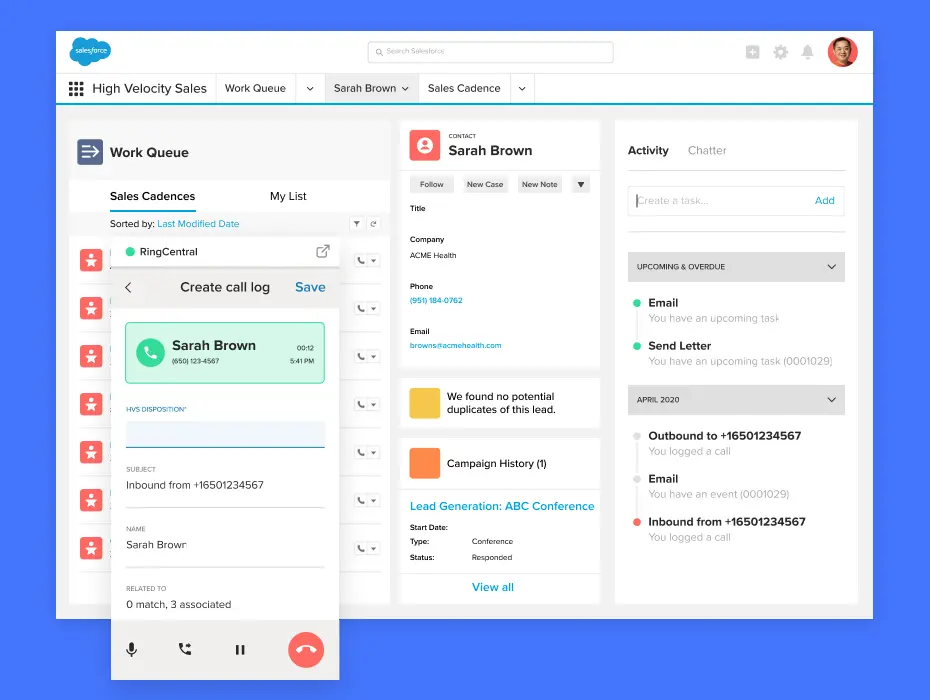
One easy way to streamline your sales metrics? Hook your cloud phone app into your CRM software. RingCentral, for example, pairs with CRMs like Salesforce, Hubspot, Zendesk, and more. Every inbound and outbound call is made via RingCentral right within your CRM of choice, so there’s no need to manually enter the info after your calls. Here’s how RingCentral’s Salesforce integration looks:
Want to learn more? Read about the benefits of CRMs for small business sales.
Common sales metrics tracked by small businesses
We know we just dropped a lot of options for sales metrics tracking. But don’t panic! You don’t have to track every single item we listed here. Every small business is different, so it’s up to you to determine which of these metrics are most meaningful for you and your team.
Your industry can determine what your sales metrics need to be. For example, the advertising industry might use different goals than an IT consulting firm.
It’s also important to think about what your company specifically needs. For example, if you are using a startup business model where you have low overhead and a small team, you might need to focus on lead generation metrics.
On the other hand, if you have an established business that is trying to expand its clientele, you might focus more on sales activity metrics.
Here are some of the most common sales metrics used by small businesses:
Average close rate
Your average close rate is how many deals you complete out of all the opportunities that come to you. It’s also known as the close ratio.
Average Close Rate = Total number of closed opportunities/Number of opportunities
If a company has 1,000 opportunities and closes 100 deals, its close rate would be 10%.
Average sale price
Average sale price is the average amount of revenue that your company makes on each deal.
Average Sale Price = Total revenue/Total number of closed opportunities
If the company from the previous example makes $5,000,000 in sales and closes 100 deals, the average sale price is $50,000.
Customer acquisition cost (CAC)
Customer acquisition cost is how much you spend to bring in one new customer. It includes marketing and advertising expenses, salaries for staff, and any other expenses necessary to acquire a new client.
Customer Acquisition Cost = Total sales and marketing expenses/Number of new customers won or purchased
If the company from the example above has $3,000,000 in sales and marketing expenses and brings in 100 new customers, its CAC is $30,000.
Profit margin
Profit margin is an indicator of how much money your company is making after expenses, salaries, and other costs. It is expressed as a percentage. You can calculate your profit margin using the formula below or use a margin calculator for ease.
Profit Margin = (Revenue – total expenses)/Revenue
If the company from the example above makes $5,000,000 in revenue and has expenses of $3,000,000, its profit margin is 40%.
Customer retention rate
The customer retention rate is the percentage of your existing customers that continue to do business with you.
Customer Retention Rate = Number of customers at the beginning of a specific period/Number of customers at the end of that specific period
If the company from the example above has 500 customers at the beginning of a year and 550 customers at the end, its customer retention rate would be 105%.

Customer churn rate
The customer churn rate is the percentage of customers lost each year. This metric might be more important if you are in a highly competitive industry with high customer turnover.
Customer churn rate = (Number of customers at the end of a specific Period – number of new customers gained during that period)/Number of customers at the beginning of that period
If the company from the example above has 500 customers at the end of a year and loses 150 during that year, its customer churn rate would be 30%.
Customer lifetime value (CLV)
The customer lifetime value is the total revenue you expect to make from a customer over the course of its relationship with your business.
Customer lifetime value = Average sale price x Customer retention rate x Number of years a customer is expected to stay with your company
If the company from the example above has an average sale price of $50,000 and a customer retention rate of 105%, and an average customer stays with the company for five years, its CLV is $250,000.
Lead-to-win ratio
The lead to win ratio is how many leads it takes you to close one deal. If a company receives 100 leads and closes 10 deals, its lead to win ratio is 10%.
Lead to win ratio = Number of deals closed/Number of leads generated
The lead to win ratio is different from the close rate because it takes into account prospects that didn’t become customers. For example, if you get 100 leads but your close rate is 10%, that means 90 of those leads didn’t become customers.
Number of opportunities created
Opportunities created is the number of leads that you added to your funnel during a specific time period. Your company can add opportunities by marketing to new leads, adding prospects from inbound leads, or creating opportunities with existing clients.
Number of opportunities created = Number of leads added – number of leads lost
If the example company has 1,000 incoming leads and adds 100 to its pipeline, then it added 900 opportunities. At the same time, if it loses 100 leads during the period, then it is left with 900 opportunities created.
Challenges of tracking sales metrics and analytics
Setting goals can be difficult, especially as a small business in its early years, when there’s little comparison data for setting benchmarks. Many people choose easy-to-reach goals that they know they can achieve without too much trouble. However, these types of goals give no motivation to try to improve and you will not be able to track real progress.
It can also be hard for sales teams to track metrics and analytics because they cannot always understand the data they have. Creating a sales analytics guide or document can help your team get more familiar with the data you are collecting.
It is also difficult to track data for a small business, especially if you do not have a large team or a lot of data points to use yet. You might need to tighten your focus and track only a couple of the most important metrics.
The good news: there’s no need to reinvent the wheel. Don’t be afraid to ask your peers and other companies about their sales analytics. There is a good chance that if they’re doing it right, you’ll be able to learn from them.
Sales metrics for small businesses: Your key to closing more deals
Analyzing sales metrics can really be a springboard for growing your customer base and selling more. But don’t feel overwhelmed! Tracking any aspect of your sales process is bound to show you your team’s strengths and the opportunities for improvement. So start small. Track a few of the most meaningful metrics for a quarter, or even half a year. See what that baseline data reveals; you might be surprised!
From there, you can build out a more robust plan of action for tracking—and acting on—the results. Because all of these numbers don’t mean much if you don’t use them to improve.
Updated Mar 13, 2025