Sign up to get quick access to a full product demo
Call center metrics are essential performance indicators that measure how effectively your contact center delivers high-quality customer experiences, manages operational efficiency, and supports strategic business outcomes.
But tracking dozens of metrics isn’t the goal. The actual objective is identifying the metrics that matter most and knowing how to use them to improve performance.
By organizing key metrics into clear categories and prioritizing the ones that directly impact outcomes, such as customer satisfaction, resolution rates, and cost efficiency, you can make smarter, faster decisions. RingCentral's RingCX platform simplifies this process with pre-built dashboards, unified analytics across channels, and AI-powered insights that turn raw data into actionable improvements.
Call center metrics are measurable data points that reveal how well your team serves customers, where bottlenecks exist, and which areas need improvement.
While the terms “metrics” and “KPIs” are often used interchangeably, there’s an important distinction:
Most call centers track dozens of metrics, but you only need to monitor a handful of KPIs to guide strategic business decisions.
The most effective way to manage performance is to group contact center metrics by business objective. Instead of tracking everything equally, focus on the following four core categories.
To understand how customers perceive your service and whether issues are resolved effectively, monitor:
These metrics directly influence retention and brand perception.
To reveal how efficiently your contact center operates and where you can reduce costs, track:
These metrics impact scalability and average cost.
To identify bottlenecks in queues, routing, and responsiveness, measure:
These metrics highlight staffing and workflow issues.
To show how effectively your agents manage their workload to maintain call center/agent productivity, measure:
These metrics reveal the balance between operational efficiency and the agent experience.
To understand the root causes behind your data, track:
AI-powered analytics (like RingCentral’s AI Conversation Expert) analyze 100% of customer interactions to uncover patterns that manual quality assurance misses.
Not all metrics carry the same weight. Prioritizing a small group of call center KPIs ensures you focus on those that drive the majority of your performance outcomes.
The table below summarizes the most important call center metrics, what they measure, and why they matter.
Metric | What it measures | Why it matters |
|---|---|---|
First contact resolution (FCR) | % of issues resolved in one interaction | Reduces repeat contacts and lowers cost while improving satisfaction |
Customer satisfaction (CSAT) |
FCR measures how often customer issues are fully resolved in a single interaction, and without follow-ups, transfers, or callbacks. Resolving issues on the first attempt is one of the most effective ways to reduce operational costs and improve satisfaction at the same time.
Formula: (Issues resolved on first contact ÷ Total issues handled) × 100
Benchmark: According to recent research, 70% to 79% is good, while world-class performance is 80% or higher.1
How to improve FCR:
AI-powered routing and real-time assistance help agents resolve issues faster without increasing handle time.
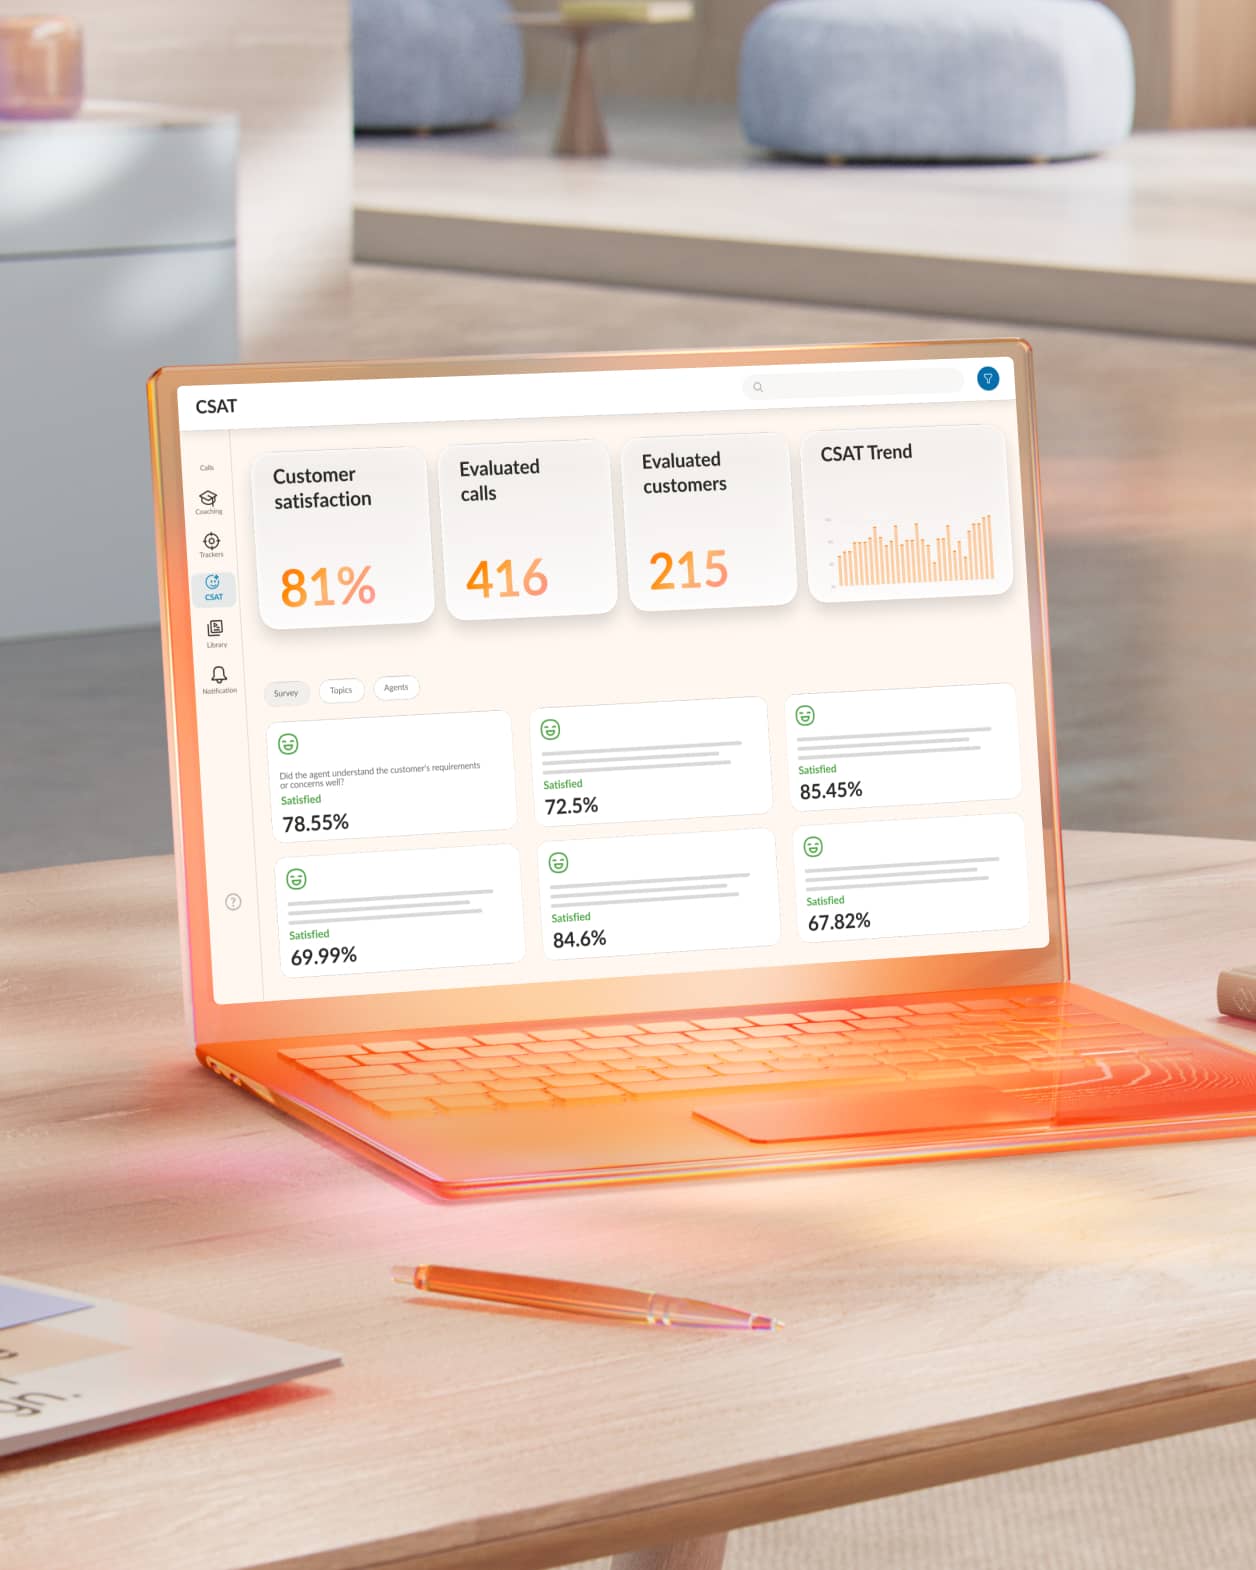
CSAT measures how satisfied customers are with a specific interaction, typically through post-call surveys. It gives you a direct view into how customers experience your service, but it’s most useful when you can pinpoint why satisfaction rises or falls.
Formula: (Satisfied customers ÷ Total survey responses) × 100
Benchmark: The American Customer Satisfaction Index reports that call center satisfaction benchmarks have recently reached 79% to 81% in key service sectors.2
How to improve CSAT:
The more visibility you have into each interaction, the easier it becomes to turn insights into better experiences.
AHT measures how long agents spend on each interaction, including talk time, hold time, and after-call work. It’s essential for understanding efficiency, but speed alone doesn’t equal performance.
Formula: (Talk time + Hold time + ACW) ÷ Total number of interactions
Benchmark: A recent study found that a healthy AHT typically falls between 4–6 minutes for general support and 8–12 minutes for technical issues.3
How to improve AHT without sacrificing quality:
Reducing handle time only works when resolution quality stays high. Otherwise, repeat customer calls increase and so do costs.
Call abandonment rate shows how many customers hang up before reaching an agent, which is often a direct signal of frustration. When abandonment rises, it usually points to delays in response or gaps in staffing.
Formula: (Abandoned calls ÷ Total inbound calls) × 100
Benchmark: According to studies, a 2% abandonment rate is considered good, 5% is seen as acceptable, and anything above 5% would be viewed as problematic.4
How to improve:
Even small improvements here can significantly improve customer experience and reduce lost opportunities.
Agent occupancy rate measures how much of an agent’s logged-in time is spent actively handling interactions or completing related work. It helps you understand workload balance, but pushing it too high can quickly lead to burnout.
Formula: (Handle time + ACW) ÷ Logged-in time × 100
Benchmark: Recent agent occupancy studies found that the ideal occupancy rate falls between 75% and 85%.5 Rates above 85% are generally unsustainable and often lead to mental fatigue and higher attrition.
How to improve:
The goal is to maintain a sustainable pace that supports both performance and agent well-being.
Individually, each metric tells part of the story. Together, they give you a complete picture:
The key is to manage them as a system, not in isolation. Unified analytics and AI-driven insights can help you see how changes in one area affect performance across your entire contact center.

Optimizing call center performance means managing the relationship between multiple metrics. Because of the natural tension between efficiency and experience, this is often easier said than done:
Most contact centers rely on sampled data and lagging indicators, using traditional metrics that show what happened but not why or how to fix it.
This makes it difficult to:
As a result, teams end up improving metrics in isolation, which quickly becomes inefficient. Customer-centric contact centers pair metrics together to ensure balanced performance.
For example, this could mean:
This approach keeps efficiency and experience aligned so improvements in one area don’t create problems in another.
AI makes it possible to manage these metrics in real time, making the move toward AI-driven models a necessity. According to a 2025 Gartner survey, 91% of customer service leaders face executive pressure to implement AI, with a primary focus on improving customer satisfaction, operational efficiency, and self-service success.6
Instead of relying on partial data, modern platforms like RingCX use AI to analyze 100% of interactions across channels. This gives you a complete, continuous view of performance, turning metrics into signals you can act on immediately:
This level of insight makes it easier to connect metrics and manage them as a system. For example, if AHT increases, RingCX helps you determine whether:
Instead of applying a one-size-fits-all fix, you can respond with targeted improvements that protect both efficiency and experience. This allows you to establish a more balanced, responsive contact center where efficiency, quality, and agent experience improve together.
Improvement in customer sentiment
Reduction in time to close cases
Point NPS improvement
A dashboard that only displays data isn't enough. Follow these steps to create a system that triggers decisions and workflows the moment performance deviates.
Without clear ownership, metrics become decorative. Every KPI on your dashboard needs an owner responsible for monitoring it and acting when thresholds are breached. Assign supervisors to real-time operational metrics like active waiting calls and ASA, and designate team leads or managers for daily review of FCR, CSAT, and AHT trends.
Equally important is defining what happens when a threshold is crossed. Document escalation procedures in advance: if the abandonment rate exceeds 5% for 15 consecutive minutes, who gets notified and what actions are authorized? Pre-defined workflows prevent the hesitation that turns a manageable spike into a service failure.
Most contact centers pull data from multiple systems—CaaS platforms, CRM tools, workforce management software, and quality monitoring applications—and conflicting metric definitions across these systems often lead to poor decisions.
Establish unified definitions before you build your dashboard. Agree on exactly how each metric is calculated, which system is the source of record, and how data from different platforms gets reconciled. Platforms like RingCX reduce this complexity by consolidating contact center data across voice, digital, and AI-assisted interactions into a single analytics layer with standardized metric definitions.
The most effective dashboards go beyond showing problems by triggering corrective actions automatically. Configure alerts that notify supervisors the moment key metrics breach defined thresholds, whether that's an abandonment rate climbing above your service level agreement (SLA) target or ASA exceeding 30 seconds during call volume spikes.
Where possible, automate the response itself. Modern CCaaS platforms can trigger routing adjustments, activate overflow queues, or send callback prompts to waiting customers without manual intervention. This shifts your team from reactive firefighting to proactive management.
Call center metrics do more than track performance. They drive data-driven decisions across staffing, budgeting, and customer experience.
Process improvement is another core use case. Tracking average age of query alongside repeat call rates helps you identify issue types that consistently escape first-contact resolution. These trends point to knowledge gaps, agent authority limitations, or process bottlenecks that agent training alone won't fix.
According to McKinsey, AI adoption in business functions has reached 88% of organizations.7 Contact centers are increasingly using AI-powered analytics to predict future demand and proactively adjust operations before problems arise.
Managing call center performance across disconnected tools creates delays, inconsistencies, and missed insights.
RingCX brings everything together, consolidating omnichannel data, AI-powered analytics, and real-time dashboards into a single platform. Instead of reacting to metrics after the fact, you can:
From reducing after-call work with AI summaries to improving FCR through intelligent routing, RingCentral helps you translate metrics directly into better customer experiences and lower operational costs.
1. First call resolution (FCR): A comprehensive guide. SQM Group. (n.d.).
2. Rizzo, C. (2026, February 3). Press Release: Retail and consumer shipping study 2026. The American Customer Satisfaction Index.
3. 25 call center metrics for QA managers. Gistly. (n.d.).
4. Pearce, J. (n.d.). How to measure call abandon rate. Call Centre Helper.
5. Understanding agent occupancy for modern call centers. Metropolis Corp: UC Analytics, CDR, Call Reporting & Contact Center Solutions. (n.d.).
6. Press announcement: Gartner Survey finds 91% of customer service leaders under pressure to implement AI in 2026. Gartner. (2026, February 18).
7. Singla, A., Sukharevsky, A., Hall, B., Yee, L., Chui, M., & Balakrishnan, T. (2025, November 5). The state of AI in 2025: Agents, Innovation, and transformation. McKinsey.
Partners
Open Ecosystem
Learning
Company
Help & Support
Customer rating of a specific interaction
Directly indicates service quality and experience |
Average handle time (AHT) | Average time spent per interaction (talk + hold + after-call work) | Impacts efficiency, staffing, and cost per interaction |
|---|
Call abandonment rate | % of callers who hang up before reaching an agent | Signals poor experience and missed opportunities |
|---|
Agent occupancy rate | % of logged-in time spent handling interactions | Indicates workload balance and burnout risk |
|---|