Better yet, why don’t you try it for yourself? With RingCentral, you can have access to a full product demo so you can see what you can do with the full power of call center analytics. Go to our site and try it today.

If you have a call center, you know how important it is to observe and track your team’s performance and productivity. To do this, you need to do more than just analyze your call volumes. So, what metrics must you track to gauge how your call center is performing?
It’s important to look closely at how well your company and agents are serving your customers. To track this, your company should focus on call center agent performance metrics that track the customer experience.
As contact center managers, even if your CX metrics show excellent customer service, you still need to make sure your call center is running as efficiently as possible. The call center metrics to measure in this case focus on agent productivity and operational success.
In this post, we’ll look at the top metrics to track. We’ll go over:
What are contact center metrics and why are they important?
Contact or call center metrics help you investigate patterns in your workforce or customer behavior. You can do that by looking at trends in the quantitative data. Quantitative data is number-based information that tells you how your call center is performing.
Tracking metrics allow you to measure agent productivity and performance management using hard data. It takes the guesswork out of measuring how well you and your team are meeting the needs of your customers and company objectives.
Call centers are diverse places. You may have a large percentage of your workforce remote working or you may have dozens of team members handling customer calls at the same time.
As a call center manager, it’s nearly impossible to gauge how well your team is doing based solely on observing day-to-day operations. Tracking metrics allows you to accurately measure short-term and long-term call center performance.
Metrics that track agent performance
At a call center, your main objective is to provide the best customer experience to your callers.
You want to solve their problems quickly and make them advocate for your business. So, to track the performance metrics of your agents you need to focus on how they contribute to the customer experience.
The key metrics you need to track include:
- Customer satisfaction
- First call resolution
- First response time
- Average call abandonment rate
- Customer effort score
- Customer churn rate
- Net Promoter Score®
1. Customer satisfaction
One of the best indicators of agent performance is how satisfied your customers are with their experience. However, measuring customer satisfaction or CSAT can be tricky because there is no standard way to calculate it.
Most companies use customer surveys to obtain the data they need to calculate their customer satisfaction score. CSAT responses are usually rated on a five-point scale and expressed on a score from 0 to 100 percent.
Responses can range from ‘highly unsatisfied’ to ‘highly satisfied’ with ‘5’ being the highest numerical score that can be achieved.
Use the following equation to calculate your overall CSAT score:
CSAT = (Number of customer ratings of 4 or greater / number of survey responses) x 100
While this metric is vital to track agent performance, it’s not the greatest metric to track if you want to find ways to improve call center CX.
A CSAT survey should always be used in conjunction with other performance metrics to track your key performance indicators or KPIs.
KPIs help evaluate performance while looking at the processes that are behind your success and creating goals.
2. First call resolution
First call resolution (FCR), also called first contact resolution, measures how well your contact center agents resolve customer issues, questions, and needs during their initial interaction. This can be through any communication channel your call center supports, including Facebook, SMS, online chat, etc.
As a call center, you want to be available for follow-up support. However, you should strive for an excellent FCR score. This means that your customer is satisfied with their service and you meet all their needs the first time they contact you.
The equation used to calculate FCR is:
FCR = total calls resolved on the first attempt / total number of incoming calls
While this seems like a straightforward metric, it can be difficult to assess correctly. The key is to develop a framework that is implemented consistently across your contact center. This framework needs to have a clear definition of resolution. This will help you achieve an accurate and consistent first call resolution rate.
You can define resolution by measuring the times a customer calls back within a certain timeframe. To do this, you need to know who the caller is for each call and match it up with their call history. Another way is to have the agents themselves log if the call was completed properly. However, this may incentivize them to increase their scores because they are essentially grading themselves.
3. First response time
The metric, first response time (FRT), measures the average amount of time it takes for an agent to issue a first response to a customer question or concern.
Even during peak hours, you should try to make your FRT as short as possible. It illustrates to your customers your commitment to their needs and the efficiency of your company.
To calculate average FRT:
FRT = total time from query to initial response / total number of inquiries
To measure this as a key performance indicator, set an achievable goal for your FRT.
What’s considered a ‘good’ FRT score depends on the mode of communication. For example, ticketing systems generally need call back times of 24 hours or less, whereas customers expect the average speed of answer for a live chat to be less than 90 seconds.
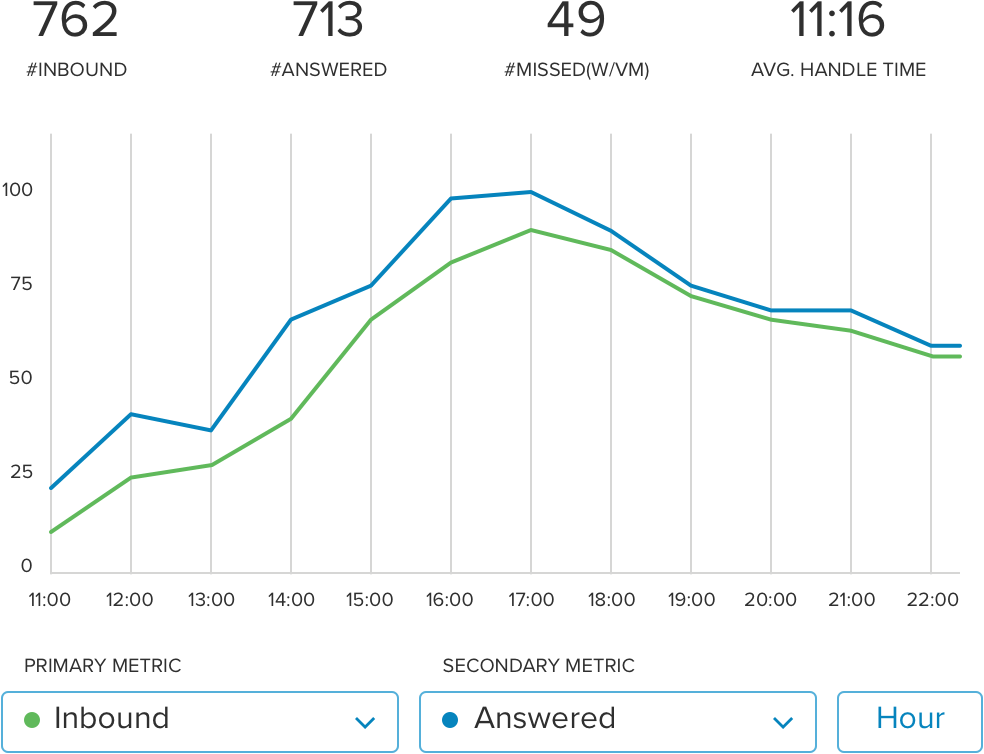
With RingCentral, you can measure this directly in your dashboard. You can customize the period in which you’re gauging the metric, as well as the number of team members you’re evaluating. Are you measuring across the entire call center, a team, or an individual? RingCentral gives you the flexibility to choose.

4. Average call abandonment rate
This performance metric is one of the most commonly measured KPIs for inbound call centers. It evaluates the rate at which inbound calls end prematurely.
The abandoned call must occur before the call center agent resolves the reason behind the call or as the call center agent is trying to help them. It indicates your service level and the overall customer experience.
This is how you calculate call abandonment:
Call abandonment rate = (number of calls - number of calls handled) / number of calls
An industry standard for an acceptable call abandonment rate is 5-8%. Abandoned calls will always occur in a call center due to poor reception or because the customer had something that needed their attention.
However, if you have a high abandon rate, you should consider whether it’s poor call quality or if your customers are getting frustrated, leading to a hang up. If it’s either of these two that push up your call abandonment rate, take steps to improve.
5. Customer effort score
The customer effort score or CES measures how easy the service experience is for your customers.
Your call center agents should be working to make your customers’ lives as simple as possible. This score allows you to analyze how easy it is for customers to interact with, and get their problems solved by, your contact center.
Like the customer satisfaction score, the CES is typically gleaned via a survey to rate how easy a caller’s interaction was, rated on a seven-point scale.
In this case, seven would be to ‘Strongly Agree’ that interaction was easy and one representing ‘Strongly Disagree’.
Then it is converted into a numerical value. The higher the number, the better the CES.
CES = (number of customer ratings of 6 or greater / number of survey responses)
Making things convenient for your customer is essential for excellent call center performance. Call centers that provide an outstanding customer experience will have higher customer retention rates and better customer interactions.
6. Customer churn rate
Customer churn rate calculates the percentage of customers who end their relationship with your company within a given timeframe. It’s a great way to calculate customer loyalty in subscriber-based and non-subscriber-based service models.
To calculate customer churn rate, use this formula:
Customer churn rate = (customers lost / starting customer numbers) x 100
Not only can you use churn rate to calculate lifetime value, but it’s also an excellent indicator of performance. If you have high churn rates over a set time period, you need to uncover why your contact center is not retaining customers.
7. Net Promoter Score®
Another metric you can use to calculate customer loyalty and predict churn is your Net Promoter Score or NPS. In a Harvard Business Review, Bain and Company introduced this metric and it was quickly adopted by Fortune 500 companies.
The question asked to customers is simple: “How likely is it that you would recommend our contact center to family and friends?”
Customers then use a 10-point scale to rate your company, 10 being “extremely likely” and 0 being “not at all likely”
Your customers are then divided into three categories:
- Promoters (9-10): These are your brand ambassadors who are most likely to refer friends and families.
- Passives (7-8): These customers are satisfied with your service, but are unlikely to promote your company.
- Detractors (0-6): Customers who are detractors are likely to share negative opinions about your call center with the people they know.
NPS is then calculated through the following formula:
NPS = (% of 9 to 10 responses) / (% of 0 to 6 responses)
To make the most of your NPS score, make sure to ask follow-up questions in your survey. Why do promoters love your company? Why are your detractors unsatisfied with your service?
Metrics that measure productivity and operational success
The metrics that measure the customer experience are an important indicator of call center success. However, measuring productivity and operational success is equally important.
It ensures that your agents have an efficient workflow and are meeting performance expectations. Here are some important metrics to utilize to measure this:
- Calls answered per hour
- Cost per Call
- Average handle time
- Average speed of answer
- Occupancy rate
- Call transfer rate
- Schedule adherence
1. Calls answered per hour
This is an easy metric to calculate and also one of the most important. You can track this metric on an individual agent basis or by team as a company-wide metric. How productive are your agents at fielding calls and resolving customer questions or concerns?
If you’re going to measure calls answered per hour, also use CX metrics to make sure your customers aren’t suffering due to the large number of calls you field per hour. Make sure your agent spends adequate time on each call. You want to balance staffing and call volume with customer service.
Calculate calls answered per hour using this equation:
Calls per hour = (calls taken) / (total time worked - idle or wait times)
2. Cost per call
At the end of the day, your call center needs to keep an eye on expenses and your bottom line. The best way to do this is to track cost per call. Why does cost per call matter? Well, it examines how:
- Efficiently your money is spent in relation to labor.
- Effectively you are spending money.
- Efficiently your team is handling calls.
Just remember, cheaper isn’t always better. When you track costs per call, make sure that your quality assurance and workforce management keeps focused on the customer and employee experience.
3. Average handle time
Similar to calls per hour, average handle time or AHT measures how efficiently agents are using their time.
It’s the average duration of a customer interaction. This includes hold times, waiting times, talk time, transfers, and after call work time.
Your average handling time tracks the time it takes on average for agents to resolve a customer interaction. You essentially just add up the average time from when a customer or agent dials to when they close the case.
If your handling times are too long, break down the AHT into its constituent parts to see what is taking up the most time.
For example, if the greatest contributing factor to your AHT is hold times, investigate ways you can reduce this specific aspect of the metric. This will actively work towards improving call times and having a better customer experience.
4. Average speed of answer
Average speed of answer or ASA also tracks call center efficiency. It can be an excellent indicator of insufficient staffing. It can also indicate how responsive your call center is to incoming calls.
Here is the equation to calculate ASA:
ASA = total wait time for answered calls / total number of answered calls
Like other indicators of call center productivity, lower ASAs do not necessarily mean better performance. You need to consider labor costs, CX metrics, and cost per call to indicate if your ASA score is meeting your company’s goals.
5. Occupancy rate

A call center occupancy rate measures how busy your center’s agents are throughout the day. It compares idle time and call handle times. Calculating occupancy rates allows you to track agent utilization KPIs over a period of time. It creates the basis for managing peak hour traffic and cutting labor costs during times when your call center experiences a lull.
Occupancy rate = handle time / (handle time + available time)
6. Call transfer rate
As we saw with the AHT score, call transfers have a strong impact on call center productivity. While you do need to transfer calls at a call center, you need to make sure it isn’t done on every call.
A high call transfer rate can lead to a poorer customer experience due to:
- Dropped calls
- Having to repeat their needs to a different agent
- Longer wait and hold times
- Reduced confidence that your call center can solve their inquiry or concern
To calculate your Call transfer rate:
Call transfer rate = (number of calls transferred) / (total number of calls) x 100
7. Agent schedule adherence
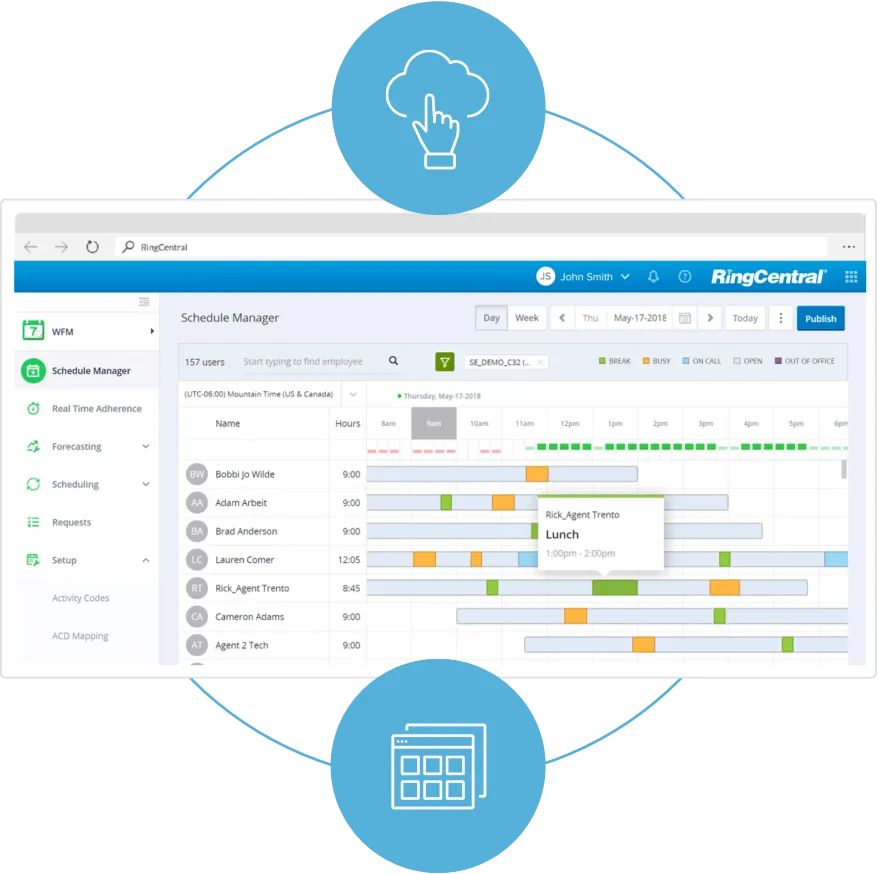
Agent schedule adherence focuses on your agents by tracking whether or not they are adhering to their work schedules. It looks at the specific times agents are scheduled to work compared to the percentage of that time they are available to take calls.
The equation to measure this metric is:
Schedule adherence = (AHT + other work-related activities) - (non-work-related activities + breaks)
In this case, the higher the score, the more your agents are adhering to their schedule. However, a 100% adherence to schedule is unrealistic. You want your agents to feel like they have adequate time to stop and catch their breath during their workday. On the other hand, if a score is too low, your company is operating inefficiently.
How to use analytics software to track call center KPIs
You now know the key metrics your call center should track for workforce optimization. But, what technology is available to help you track center KPIs and metrics with so many moving parts?
RingCentral makes it easy to track call center metrics and KPIs using your call center software.
More specifically, RingCentral uses call center analytics software to track your company’s KPIs in real-time. You can set benchmarks and specific goals for individual agents, as well as the entire center operation.
Analytics software even lets you track KPIs for activities that don’t involve your agents. For example, you can track self-service effectiveness through the interactive voice response (IVR) feature. IVR interacts with callers using an automated phone system.
The dashboard is completely customizable, so you can track the metrics you want when you want them. To learn more about how RingCentral can help boost your analytics capabilities, watch this video and subscribe to our blog:
